

Mastering the Cox Proportional Hazards Model for Biomedical Research
- Feb 25
- 6 min read
If you are analyzing time-to-event data in pre-clinical studies—such as tumor latency in mice, time-to-failure in biomaterials, or cell culture viability—you have likely started with Kaplan-Meier curves. But what happens when you need to account for multiple variables simultaneously?
Perhaps you observed that your treated mice survived longer, but they also started with lower body weights. Is the drug working, or is it just the weight difference? Kaplan-Meier cannot answer that.
The Cox Proportional Hazards Model is the solution. It is the gold standard for multivariate survival analysis, allowing you to isolate the effect of a specific treatment while mathematically "controlling" for other biological confounders like genotype, age, or sex.
This guide is your authoritative resource for mastering the Cox model, specifically tailored for the biomedical researcher. We will move beyond dry theory into practical application, interpretation, and troubleshooting.
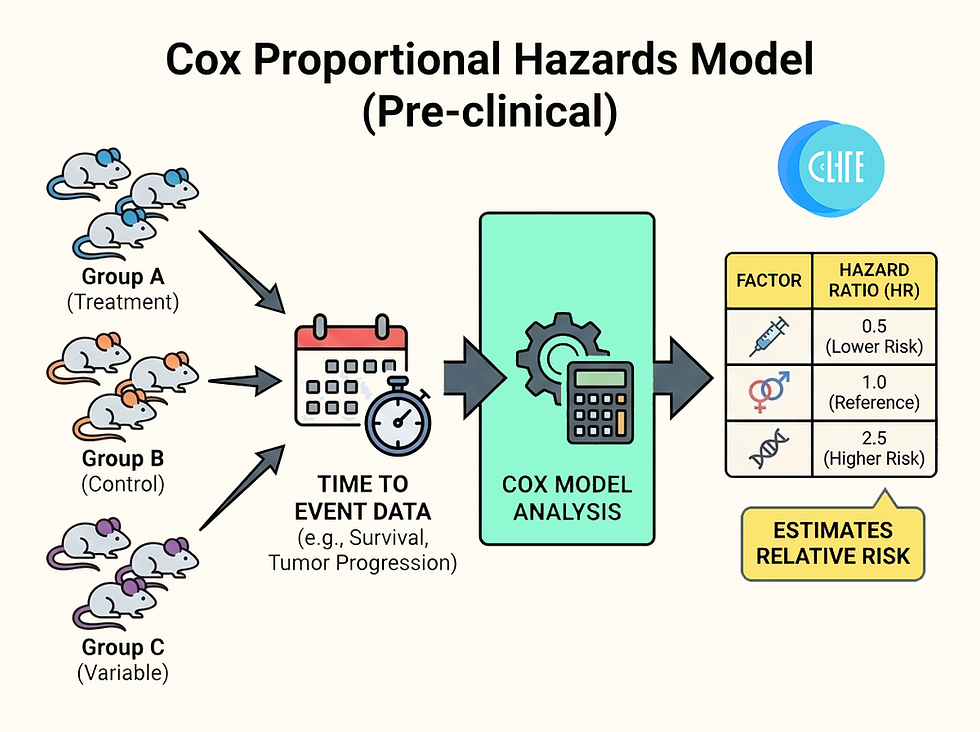
1. What is the Cox Proportional Hazards Model?
The Cox Proportional Hazards (PH) Model is a semi-parametric statistical technique used to assess the relationship between the survival time of subjects and one or more predictor variables (covariates).
Unlike parametric models (e.g., Weibull), the Cox model does not assume a specific statistical distribution (shape) for the survival times. It only assumes that the effects of the predictor variables upon survival are constant over time.
The Core Concept: The Hazard Function h(t)
In survival analysis, we don't just look at "death"; we look at the hazard.
Hazard (h(t)): The instantaneous risk that an event (e.g., death, tumor onset) will occur at time t, given that the subject has survived up to that point.
The Cox model formula is:
h(t) = h0(t) X exp(b1x1 + b2x2 + ... + bpxp)
h(t): The hazard for a specific subject.
h0(t): The Baseline Hazard. This is the risk when all your variables (x) are 0 (e.g., control group).
exp(...): The mathematical engine that scales the baseline risk up or down based on your experimental variables.
2. Why Use Cox vs. Kaplan-Meier?
In pre-clinical research, the distinction is critical.
Feature | Kaplan-Meier (Log-Rank) | Cox Proportional Hazards |
Variables | Univariate (One factor at a time). | Multivariate (Multiple factors at once). |
Data Type | Categorical only (e.g., Genotype A vs. B). | Categorical AND Quantitative (e.g., Weight, Dosage). |
Output | P-value, Median Survival Time. | Hazard Ratio (HR), Adjusted P-values. |
Use Case | "Does Treatment X improve survival?" | "Does Treatment X improve survival independent of Genotype?" |
The Bottom Line: Use Kaplan-Meier for simple visualization. Use Cox regression when you need to publish robust, adjusted data that proves your treatment effect is real and not an artifact of confounding variables.
3. The Hazard Ratio (HR): The Metric That Matters
The most important output of a Cox model is the Hazard Ratio (HR). It is the effect size of your treatment.
How to Interpret HR in Pre-Clinical Studies
If you are comparing Treatment Group vs. Control Group:
HR = 1: No Effect. The risk of the event is identical in both groups.
HR < 1: Protective Effect. The treatment reduces the hazard.
Example: HR = 0.59 means the treatment group has 41% lower risk of death at any given time compared to controls.
HR > 1: Detrimental/Risk Effect. The treatment increases the hazard.
Example: HR = 2.0 means the treated mice are dying at twice the rate of the controls.
Pro Tip: In cancer research, a "good" prognostic factor (like a therapeutic drug) should have an HR < 1. A "bad" prognostic factor (like a pro-tumorigenic mutation) should have an HR > 1.
4. Step-by-Step Protocol: Running the Analysis
Whether you use R, GraphPad Prism, or Python, the scientific logic remains identical.
Phase 1: Data Preparation
Your data must be structured in "Long Format" with at least three columns:
Time: The duration from study start to the event or end of study (e.g., Days).
Status (Censoring): Did the event occur?
1 = Event happened (e.g., mouse died).
0 = Censored (e.g., mouse survived to end of study).
Covariates: Your experimental variables (e.g., Treatment, Genotype, TumorSize).
Phase 2: Implementation (Choose Your Software)
Option A: R (The Gold Standard)
R is preferred for complex datasets. We use the survival and survminer packages.
# Load libraries
library("survival")
library("survminer")

# Fit the model
# status: 1=event, 0=censored
res.cox <- coxph(Surv(time, status) ~ treatment + genotype + weight, data = my_mouse_data)

# View results
summary(res.cox)
Option B: GraphPad Prism (The User-Friendly Choice)
Select Survival from the New Table dialog.
Enter data columns. For multivariate, ensure you select Multiple variables (Cox regression).
Column A: Time. Column B: Outcome (1 or 0). Subsequent Columns: Predictors (Treatment, Sex, etc.).
Click Analyze > Survival Analysis > Cox proportional hazards regression.
In the dialog, define your "Reference Level" (usually the Control/Vehicle group).
Phase 3: Checking Assumptions (Crucial!)
The Cox model relies on the Proportional Hazards Assumption: The ratio of hazards between groups must remain constant over time.
Visual Check: If the Kaplan-Meier curves cross each other significantly, the assumption is likely violated.
Statistical Check: In R, use the cox.zph() function. If the p-value is < 0.05, the assumption is violated (see Troubleshooting).
5. Pre-Clinical Case Study: Drug X efficacy in p53-/- Mice
Scenario: You are testing a new inhibitor (Drug X) in tumor-prone mice.
N: 50 mice.
Variables:
Treatment (Vehicle vs. Drug X)
Sex (Male vs. Female)
Baseline Tumor Volume (Continuous numeric)
Results Output:
Covariate | Coef (β) | HR (eβ) | P-value | Interpretation |
Drug X | -0.69 | 0.50 | 0.002 | Drug X reduces risk of death by 50% compared to Vehicle. |
Sex (F) | -0.10 | 0.90 | 0.350 | Sex has no significant effect on survival. |
Tumor Vol | 0.40 | 1.50 | 0.010 | Larger initial tumors significantly increase risk. |
Conclusion: Even after adjusting for the fact that some mice started with larger tumors, Drug X significantly extends survival (HR=0.50, p=0.002). This is a much stronger conclusion than a simple Kaplan-Meier curve could provide.
Cox Proportional Hazards Model Troubleshooting & Frequently Asked Questions (FAQ)
My Kaplan-Meier curves cross. Can I still use Cox?
No, crossing curves indicate that the hazard is not proportional (e.g., a drug works initially but becomes toxic later).
Solution: Use a Stratified Cox Model. You "stratify" by the variable causing the non-proportionality, allowing it to have a different baseline hazard shape while keeping other coefficients constant.
How do I handle small sample sizes (n < 10 per group)?
Cox models rely on "asymptotic theory," which requires decent sample sizes. For very small n, the standard errors may be inflated. Stick to univariate Log-Rank tests if your N is very low, or reduce the number of covariates in your Cox model to avoid overfitting.
What is "Censoring"?
Censoring occurs when you don't know the exact survival time (e.g., the mouse was still alive when you published the paper). The Cox model handles this mathematically. Never delete censored subjects; label them with Status = 0.
What is the Cox proportional model?
It is a statistical model used to predict the risk (hazard) of an event occurring over time based on multiple variables. Unlike other models, it is "semi-parametric"—it calculates how factors like drug dosage or genotype multiply the risk, without making strict assumptions about the shape of the baseline survival curve.
How does a Cox proportional hazards model work?
It works by separating the risk into two components:
The Baseline Hazard (h0(t)): The underlying risk of death over time for a standard control subject (this part is unspecified/non-parametric).
The Covariate Effect (exp(bX)): An exponential formula that calculates how much your specific variables (like Treatment) shift that baseline risk up or down (this part is parametric).
Simply put: It takes the "normal" risk and multiplies it by a factor derived from your variables.
How to interpret Cox regression model?
The primary interpretation comes from the Hazard Ratio (HR) and the P-value:
Look at the HR. If HR < 1, the factor reduces risk (protective). If HR > 1, the factor increases risk (detrimental).
Look at the P-value. If P < 0.05, the effect is statistically significant.
Example: "An HR of 0.5 (p=0.01) means the treatment reduces the instantaneous risk of death by 50% compared to controls."
What is the difference between Kaplan Meier and Cox proportional hazards model?
Kaplan-Meier is a univariate method. It can only describe survival for one categorical factor at a time (e.g., Group A vs. Group B) and cannot handle continuous variables like weight or age.
Cox Regression is a multivariate method. It can analyze multiple variables simultaneously (e.g., Treatment + Weight + Age), allowing you to determine if a treatment works regardless of other differences between the groups.
References
https://www.sthda.com/english/wiki/cox-proportional-hazards-model
https://numiqo.com/tutorial/cox-regression
https://www.graphpad.com/guides/prism/latest/statistics/stat_cox_regression_model.htm
https://www.youtube.com/watch?v=DpZoRqqDgXA
https://www.geeksforgeeks.org/data-science/cox-proportional-hazards-model/
https://health.ucdavis.edu/media-resources/ctsc/documents/pdfs/cph-model-presentation.pdf
https://www.graphpad.com/guides/prism/latest/statistics/stat_how_to_cox_regression.htm


