

Statistical Significance vs. Biological Significance: Why a p < 0.05 Can Still Be Meaningless
Jun 24
8 min read
You already know how to get a p-value. You run the test, you check whether it cleared 0.05, and if it did, you write "significant." The mechanics aren't the problem. The problem is a quiet assumption baked into that workflow: that "statistically significant" and "important" are the same thing. They are not, and the gap between them has its own name, biological (or clinical) significance, that rarely gets the attention the p-value does.
Here's the distinction in one line, and the rest of this article is just making it click: statistical significance is about whether an effect is real; biological significance is about whether it's big enough to care about. A result can be one without the other, in both directions.
Statistical vs biological significance: two questions one p-value can't answer
When you run a t-test or ANOVA, the p-value answers one specific, narrow question: if there were truly no difference between these groups, how surprising would data like mine be? A small p-value means "pretty surprising, so there's probably a real difference here." That's genuinely useful. But notice what it does not tell you: how large the difference is, or whether a difference that size matters to anything in biology.
Keep one fact on a sticky note above your bench: a p-value measures neither the size of an effect nor its importance. It measures one thing only, surprise-under-the-null, and any effect, however tiny, will produce a small p-value once the sample size or measurement precision climbs high enough. That last clause is the whole trap, so let's see exactly how it springs.
Why a bigger sample manufactures statistical significance
The p-value isn't a fixed property of an effect. It depends on three things tangled together: the size of the effect, the variability in your data, and your sample size. Hold the effect and the noise constant and just add more samples, and the p-value falls, mechanically, every time.
The reason is intuitive once you see it. A bigger sample gives you a more precise estimate of each group's mean, which shrinks the uncertainty around the difference between them. With enough precision, even a microscopic gap becomes "distinguishable from zero" with high confidence. The estimated p-value falls as the sample size rises, so on a large enough biomedical dataset null-hypothesis testing rejects the null almost by default, and "significant" stops carrying real information.
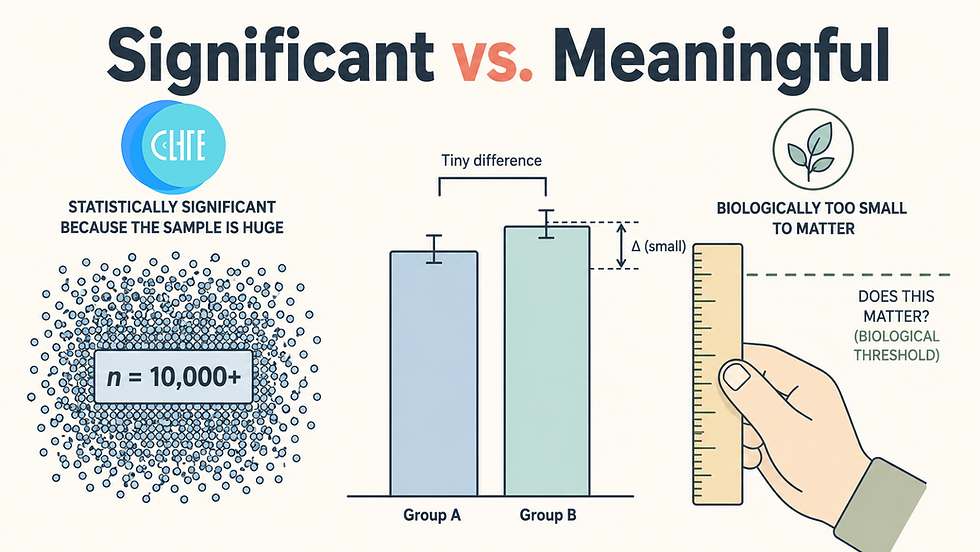
Think about what that means in practice. The p-value is partly a measure of how much data you collected, not just how real or large your effect is. Push the sample size high enough and a "significant" result is nearly guaranteed, whatever the biology. The star on your bar chart might be telling you more about your n than about your effect.
A statistically significant result that changes nothing: the 0.5 kg trial
The cleanest illustration comes from clinical research, and it transfers directly to the bench. Picture a trial with 10,000 participants testing a weight-loss drug. The treatment group loses, on average, 0.5 kg more than the control group. With a sample that large, that difference sails past p < 0.05, so it is statistically significant. It is also, for any practical purpose, meaningless: half a kilogram is within the noise of a normal day's water weight, and no clinician would change a treatment plan over it. The test did its job perfectly and told you nothing you should act on.
Blood pressure tells the same story. A drug that lowers it by an average of 3.5 mmHg can be statistically significant and still leave the clinically important question wide open, because whether a 3.5 mmHg drop changes a patient's life depends on long-term outcomes the p-value never saw. Real effect, real p-value, and still an open question whether it matters.
It has happened at scale, with consequences. A landmark trial of aspirin for preventing heart attacks was stopped early because the result was so overwhelmingly significant (p < 0.00001), and the finding shaped public-health advice for years. On closer look, the actual effect size was small enough to be practically marginal, and the blanket recommendation was later walked back. The p-value was not wrong; it was answering "is this real?" (emphatically yes, in a huge trial) while everyone heard it answering "is this a big deal?" (a different, unasked question).
Now translate it to your own work. Suppose you're comparing a marker's expression between treated and untreated cells, and with enough replicates you detect a statistically significant 2% increase. Is a 2% change in that marker biologically consequential, enough to move a pathway, shift a phenotype, or change a cell's fate? Maybe. But the p-value has no opinion on that question, and it never did. Only your knowledge of the biology can answer it.
The reverse trap: real biological significance that misses p < 0.05
The mirror image is just as dangerous and gets discussed far less. A genuinely important, large effect can fail to reach significance if your study is small or your measurements are noisy. The ASA again: large effects may produce unimpressive p-values if the sample size is small or measurements are imprecise.
This is why "p > 0.05" must never be read as "no effect." A non-significant result in an underpowered experiment often means you didn't have the precision to see it, not that there was nothing there. Treating a large-but-nonsignificant effect as a null result throws away real biology: the exact opposite error from celebrating a tiny-but-significant one, and both spring from the same root, leaning on the p-value to answer a question about magnitude that it was never built to answer.
There's a close cousin of this error worth naming, because it slips into papers constantly: comparing two results by their significance labels. You treated cells with drug A (p = 0.04, "significant") and drug B (p = 0.06, "not significant") and conclude A works and B doesn't, or that A works better than B. That inference is invalid, and it has a name: the difference between "significant" and "not significant" is not itself statistically significant. A and B may have nearly identical effects, separated only by which side of an arbitrary 0.05 line their p-values happened to land on. If you want to claim A differs from B, you have to test A against B directly, not compare each one's verdict against the null.
Beyond the p-value: report effect size and confidence intervals
If the p-value can't speak to importance, what can? Two things, and the modern consensus is to lead with them.
Effect size is the direct measure of magnitude (how big the difference actually is) and, crucially, it is not sensitive to sample size. Where the p-value conflates "real" and "large," effect size isolates "large." Depending on your design, that might be a standardized measure like Cohen's d (for a difference between means; ~0.2 is small, ~0.5 medium, ~0.8 large as rough conventions), a correlation coefficient, a risk ratio, or, often most honest of all, the raw difference in the units you actually measured (that "0.5 kg," that "2%"). The raw effect, expressed in biological units, is frequently the most interpretable thing you can report, because you can judge it against what you know matters in the system.
Confidence intervals add the other half: they show both the plausible range of the true effect and the precision behind it. A 95% CI that runs from "trivial" to "trivial" tells you the effect is small no matter how significant; one that runs from "trivial" to "huge" tells you that you simply don't have the precision to conclude much yet, information a lone p-value hides completely. This is why best practice now pairs every significance test with its effect size and confidence interval rather than reporting the p-value alone.
The practical rule that falls out of all this: report the p-value if you like, but interpret the effect size and its confidence interval. Let the p-value tell you whether you're seeing signal; let the effect size and CI tell you whether that signal means anything. (It's worth using analysis tools that surface all three together by default — Sophie reports effect size and confidence intervals alongside the p-value rather than leaving you to chase them down separately, which makes the magnitude question harder to forget.) And set the bar for "means anything" before you run the test, using your knowledge of the biology: what change in this marker, this rate, this outcome would actually be consequential? That threshold is a scientific judgment, not a statistical one, and it's yours to make.
The takeaway: significant is not the same as meaningful
A p-value is a smoke detector: it tells you something is probably there, not how big the fire is. Statistical significance vs biological significance are different questions, and the most common error in quantitative biology is letting a small p-value answer both. Add enough samples and significance becomes nearly automatic; the real scientific work is deciding whether the effect is large enough to change anything. Report the effect size, report the confidence interval, set your threshold for "meaningful" from the biology, and your significant results will also be the ones worth believing.
FAQ
What is the difference between statistical and biological significance? Statistical significance (a small p-value) indicates an observed effect is unlikely to be due to chance, meaning it's probably real. Biological significance indicates the effect is large enough to matter in a biological or clinical sense. An effect can be statistically significant but biologically trivial, or biologically important but statistically non-significant in a small study.
Why can a large sample size make a meaningless result significant? Because the p-value depends on sample size: as n increases, the estimate of each group's mean becomes more precise, the uncertainty around the difference shrinks, and even a tiny difference becomes statistically distinguishable from zero. With a large enough sample, almost any non-zero difference will reach p < 0.05, regardless of whether it's biologically meaningful.
Does p > 0.05 mean there is no effect? No. A non-significant p-value can simply mean the study was underpowered: too small a sample or too much measurement noise to detect a real effect. "Not statistically significant" is not the same as "no effect"; a large effect can fail to reach significance in a small or noisy experiment.
What should I report instead of just a p-value? Report and interpret the effect size (how large the difference is, e.g. Cohen's d, a risk ratio, or the raw difference in measured units) and its confidence interval (the plausible range and precision of the true effect). A p-value does not measure the size or importance of an effect, so it should never be the only number you report.
How do I decide if an effect is biologically significant? That's a scientific judgment, not a statistical one. Before running the test, define, from your knowledge of the system, the smallest change that would actually be consequential (a meaningful shift in a marker, rate, or outcome). Then compare your measured effect size and confidence interval against that threshold.
References
Wasserstein, R.L. & Lazar, N.A. (2016). The ASA Statement on p-Values: Context, Process, and Purpose. The American Statistician, 70(2):129–133.
American Statistical Association — statement on statistical significance and p-values (summary).
Gelman, A. & Stern, H. (2006). The Difference Between "Significant" and "Not Significant" is not Itself Statistically Significant. The American Statistician, 60(4):328–331.


