The 5 Most Common P-Value Mistakes in Biomedical Papers (and How to Avoid Each)
When medical residents were surveyed about how to interpret a p-value, 88% reported fair to complete confidence in their understanding. Then 100% of them got the interpretation wrong. Not most. All of them. And these are the people who go on to design clinical research and shape treatment guidelines.
That gap between confidence and comprehension is the reason p-value mistakes survive peer review so reliably: nobody thinks they're making one. The errors below aren't exotic. They appear in published biomedical papers constantly, they have formal names in the statistics literature, and several have been measured at scale in real journals.
Here are the five p-value mistakes worth auditing your own manuscript for, why each is wrong, and what to write instead.
Mistake 1: Reading p as the probability your hypothesis is wrong
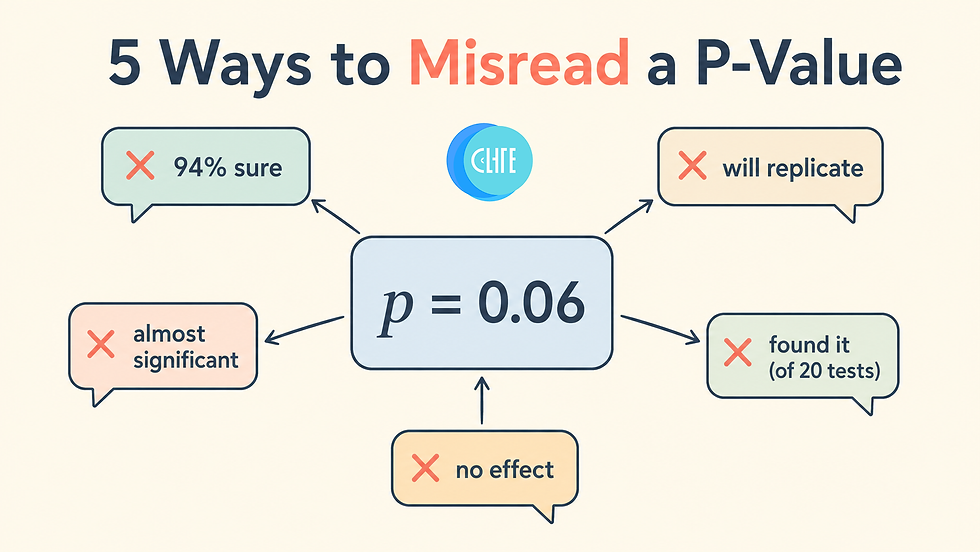
This is the inverse probability fallacy, and it is the single most documented misconception about p-values, the one researchers struggle with most in survey after survey.
The error sounds like this: "p = 0.03, so there's only a 3% chance the null hypothesis is true" or, flipped, "so I'm 97% confident my hypothesis is correct." Both are wrong, and they're wrong in the same way.
A p-value is a conditional probability running in one direction: it's the probability of observing data at least as extreme as yours assuming the null hypothesis is true. Written compactly, it's P(data | null). The fallacy flips the conditional and reads it as P(null | data), the probability the null is true given your data. Those are different quantities, and one does not convert into the other without information the p-value doesn't contain, chiefly how plausible the hypothesis was to begin with.
An everyday parallel makes the flip obvious. The probability that someone is holding an umbrella given that it's raining is high. The probability that it's raining given that someone is holding an umbrella is a different number entirely, and you'd need to know how often people carry umbrellas on dry days to work it out. Swapping those two is exactly what the inverse probability fallacy does.
Write instead:
"Under the null hypothesis, data this extreme would occur about 3% of the time." Or skip the interpretation of p as a probability statement about your hypothesis altogether and report the effect size with its confidence interval.
Mistake 2: Treating 1 − p as the chance your result will replicate
The replication fallacy is the second most common misconception, and it's seductive because it feels like a reasonable reading of "how strong is this evidence."
The error: "p = 0.01, so if I ran this study again, I'd get a significant result 99% of the time." The p-value says nothing of the sort. It carries no information about replication probability, and 1 − p is not an estimate of anything of the kind.
Replication depends on the true effect size, the sample size and power of the replication study, and the variability of the measurement, none of which is encoded in a p-value. A single significant result from an underpowered study can have a genuinely poor chance of replicating even with a small p attached.
Note:
If you want to speak to reliability, the honest tools are your confidence interval (which shows the precision of your estimate) and a proper power analysis, not an inverted p-value.
Mistake 3: Calling p = 0.06 "trending toward significance"
This one is so widespread it has been counted. In an audit of 101,134 abstracts across 15 urology journals, the word "trend" appeared 2,509 times, and 572 of those uses described non-significant data as trending toward significance.
The problem is that "trending toward significance" is not a statistical concept. It's a rhetorical rescue. A p-value of 0.06 is a single number computed from your data; it isn't moving, it has no direction, and it isn't "almost" anything. The phrase quietly implies that with a bit more data the result would have crossed the line, which is an assertion about a study you didn't run.
The tell is that nobody ever writes that a result was "trending toward non-significance" when p = 0.04. The language only ever travels in the direction the author was hoping for, which is what makes it a bias rather than a description.
Write instead:
Report the actual number and the effect size with its interval. "The difference was 3.2 units (95% CI −0.4 to 6.8, p = 0.06)" tells the reader everything, including that the data are compatible with both a meaningful effect and no effect. That's honest, and it's more informative than any adverb.
Mistake 4: Running many analyses and reporting the one that worked
Every additional test you run raises the chance that something clears p < 0.05 by luck alone. Test enough outcomes, subgroups, time points, or covariate combinations, and a "significant" result is close to guaranteed even when nothing real is there.
This is p-hacking, and in its most common forms it doesn't feel like misconduct at all. Documented varieties include measuring several outcomes and reporting only the significant ones, adding participants until the p-value drops below threshold without a pre-specified sample-size calculation, trying different exclusion criteria, and selectively adding or dropping covariates.
The subtler cousin is the garden of forking paths: even a researcher who runs only one analysis may have chosen it after seeing the data, from among many defensible alternatives. No deliberate fishing is required for the false-positive rate to inflate; it's enough that the analysis was contingent on the data. As the statisticians who named the problem put it, undisclosed flexibility in data collection and analysis allows almost anything to be presented as significant.
Caution:
This is the mistake most likely to be caught by a reviewer and most likely to make the finding unreplicable. It's worth taking seriously even when your intentions were clean.
How to avoid it:
Pre-specify your primary outcome and analysis before you look at the data; correct for multiple comparisons when you test many hypotheses (Bonferroni, Holm, or false-discovery-rate methods, depending on how many tests and how conservative you need to be); and report every analysis you ran, not just the survivors. Label post-hoc findings as exploratory and hypothesis-generating, which is a legitimate and valuable category as long as it's named.
Mistake 5: Treating 0.05 as a bright line
The last of these p-value mistakes underlies several of the others: reading 0.05 as a boundary between "real" and "not real," so that p = 0.049 and p = 0.051 land in opposite universes.
Nothing in statistics justifies that cliff. The 0.05 threshold is a convention, not a law of nature, and the evidential difference between 0.049 and 0.051 is negligible. Yet one gets an asterisk and a confident claim, and the other gets "no effect" or a "trend." Two studies with nearly identical data can be written up as contradicting each other purely because of which side of an arbitrary line they fell on.
This dichotomizing habit also drives the misreporting of non-significant results, which is the single thing researchers ask about most in practice: threads asking how to interpret or discuss an insignificant p-value run to dozens of answers apiece. Put plainly: p > 0.05 is not evidence of no effect. It usually means your data are compatible with a range of effects including zero, and often that you lacked the precision to distinguish them. Report the interval and say exactly that.
Tip:
Treat the p-value as continuous evidence rather than a verdict. "p = 0.07" is weak evidence against the null; "p = 0.001" is strong. Neither is a switch being flipped.
How to avoid these p-value mistakes: what to report instead
The fix for all five p-value mistakes is the same shift in habit: stop asking the p-value to carry the whole result, and report the three numbers that together actually describe your finding.
The effect size, in the units you measured (and standardized, if you need cross-study comparability). This answers how much.
The confidence interval, which shows both the precision of your estimate and the range of effects your data are compatible with. This answers how sure.
The exact p-value, reported as a number rather than as a threshold verdict. This answers how surprising under the null.
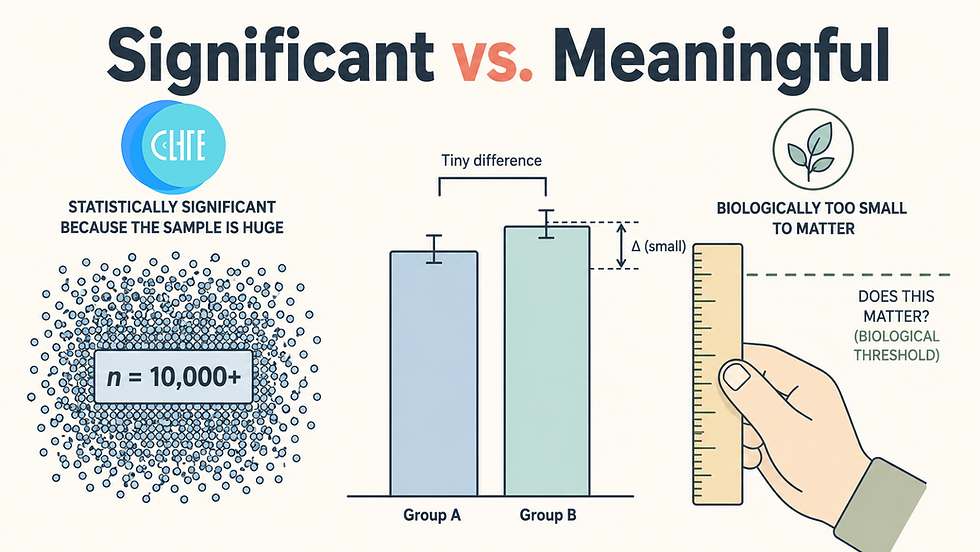
Written out, that looks like "treatment reduced closure time by 3.2 hours (95% CI 1.1 to 5.3, p = 0.004)" instead of "treatment significantly reduced closure time (p < 0.05)." The second sentence hides everything the reader needs. Reporting all three is also what makes the difference between statistical and biological significance visible, and it's why effect size deserves the central place in your results that the p-value has been occupying. Analysis tools that return the effect size and interval next to the test by default make this the path of least resistance rather than an extra step (Sophie's analytics reports and labels all three together).
The takeaway: all five p-value mistakes share one root
The five p-value mistakes above persist not because researchers are careless but because the p-value answers a narrower question than almost everyone assumes. It does not tell you the probability your hypothesis is wrong, it does not predict replication, it does not move or trend, it is easily manufactured by running enough analyses, and it does not become a different kind of evidence at 0.05. What it does tell you is how surprising your data would be under the null, and nothing more. Report the effect size and confidence interval alongside every exact p-value, pre-specify your analysis, and name your exploratory findings as exploratory. Those three habits eliminate all five errors at once.
FAQ
Does p = 0.05 mean there is a 5% chance the null hypothesis is true? No. That's the inverse probability fallacy. A p-value is the probability of data at least as extreme as yours assuming the null is true, not the probability the null is true given your data. Converting one into the other requires prior information the p-value doesn't contain.
Does a smaller p-value mean my result is more likely to replicate? No. The p-value carries no information about replication probability, and 1 − p is not the chance of replicating. Replication depends on the true effect size, the power of the replication study, and measurement variability. Use confidence intervals and power analysis to speak to reliability.
Is it acceptable to describe p = 0.06 as approaching significance? No. "Trending toward significance" is not a statistical concept, and audits have found hundreds of such misuses in published abstracts. A p-value is a fixed number, not a direction. Report the exact value with the effect size and confidence interval instead.
How do I report a non-significant result properly? Report the effect size with its confidence interval and the exact p-value, and interpret the interval. State that the data are compatible with a range of effects (which includes zero), rather than concluding there is no effect. Non-significance frequently reflects insufficient precision, not absence of an effect.
When do I need to correct for multiple comparisons? Whenever you test multiple hypotheses and interpret any significant result among them. Bonferroni or Holm corrections suit a small number of pre-planned tests; false-discovery-rate control suits large-scale testing such as omics data. Pre-specifying your primary outcome reduces how much correction you need.
What is p-hacking if I never intended to cheat? P-hacking includes any data-contingent flexibility that inflates false positives: reporting only the outcomes that worked, adding samples until p drops below 0.05, or choosing an analysis after seeing the data. The "garden of forking paths" describes how this happens without deliberate fishing, which is why pre-specification and full reporting matter regardless of intent.
References
Badenes-Ribera, L. et al. (2016). Misconceptions of the p-value among Chilean and Italian academic psychologists (inverse probability, replication, effect size, and clinical significance fallacies) — Frontiers in Psychology, PMC4993781.
Gelman, A. & Loken, E. The garden of forking paths: why multiple comparisons can be a problem, even when there is no "fishing expedition."
Head, M.L. et al. (2015). The extent and consequences of p-hacking in science — PLOS Biology.
Lytsy, P., Hartman, M. & Pingel, R. (2022). Misinterpretations of p-values and statistical tests persists among researchers and professionals working with statistics and epidemiology — PMC9383044.
False positives, p-hacking and multiple comparisons — Evaluating What Works (Bishop).