


17 hours ago5 min read
4 days ago5 min read
6 days ago4 min read
Cell viability is the foundational metric in cell biology, determining the percentage of healthy, living cells in a population. Whether you are assessing drug toxicity, monitoring cell culture health, or performing downstream applications like flow cytometry, accurate calculation is non-negotiable.
Here is the direct answer to your query, followed by a deep dive into the protocols and troubleshooting required to get reproducible data.
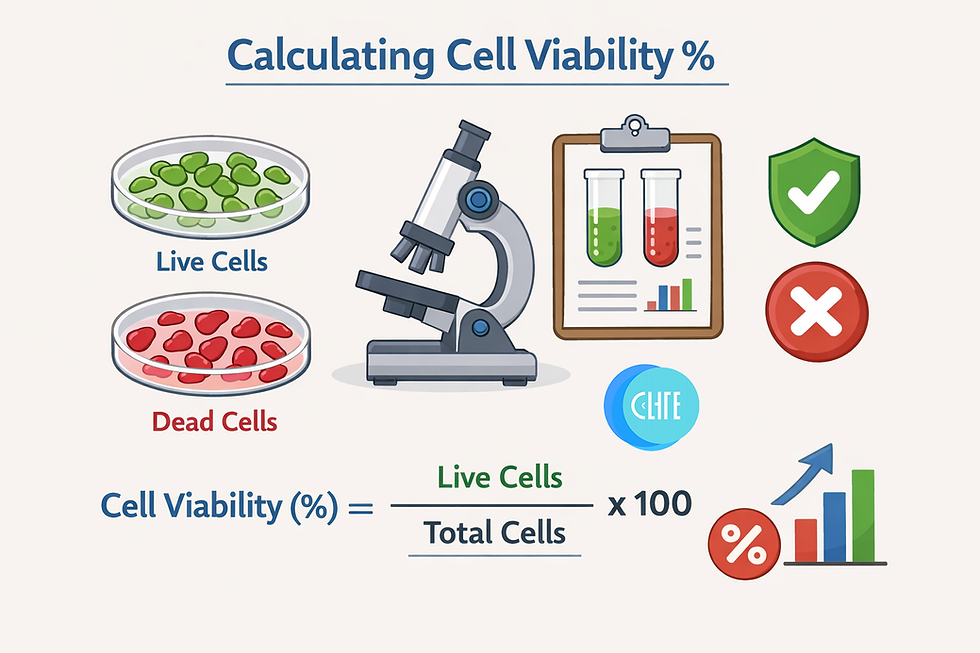
For the vast majority of manual counting applications (e.g., Trypan Blue Exclusion), the formula for calculating cell viability percentage is:
Cell Viability (%) = [Total Number of Viable Cells / Total Number of Cells] x 100
*Total Number of Cells = Viable + Dead
This method relies on membrane integrity. Live cells possess intact membranes that exclude dyes like Trypan Blue (appearing clear/bright), while dead cells have compromised membranes that allow the dye to enter (appearing blue/dark).
When using a hemocytometer, you calculate the concentration first, then the viability.
Live Cell Count: Total live cells counted in selected squares.
Dead Cell Count: Total blue-stained cells counted in selected squares.
Total Cells: Live + Dead.
Live cells counted: 180
Dead cells counted: 20
Viability = (180 / 200) x 100 = 90%
To scale this to your entire flask, use the hemocytometer formula:
Cells/mL = Average Count per Square x Dilution Factor x 10^4
Average Count: (Total cells counted) / (Number of squares counted).
Dilution Factor: Usually 2 (if you mixed 1 part cells with 1 part dye).
10^4: Correction factor for the volume of the hemocytometer chamber (0.1 mm depth).
For high-throughput screening, researchers use colorimetric assays (like MTT) where viability is proportional to metabolic activity (absorbance/Optical Density). You cannot count individual cells here; you calculate relative viability compared to a control.
Many researchers make the mistake of simply dividing the raw Optical Density (OD) values. You must subtract the "blank" (media + reagent without cells) to remove background noise.
% Viability = [(OD_Sample - OD_Blank) / (OD_Control - OD_Blank)] x 100
OD_Sample: Absorbance of cells treated with drug/condition.
OD_Control: Absorbance of untreated healthy cells (100% viability benchmark).
OD_Blank: Absorbance of empty wells with media + dye (Background).
If your background OD is 0.2 and your sample is 0.4, the raw ratio might suggest high viability. But if the "real" signal is only 0.2 (0.4 - 0.2), the viability is actually much lower. Always subtract the blank!
Objective: Determine viability using a hemocytometer.
Prepare Suspension: Detach adherent cells (using Trypsin/EDTA) or collect suspension cells. Centrifuge and resuspend in fresh media to break up clumps.
Dilute: In a microcentrifuge tube, mix 100 µL of cell suspension with 100 µL of 0.4% Trypan Blue solution.
Note: This is a 1:2 dilution (Dilution Factor = 2).
Tip: Do not let cells sit in Trypan Blue for >5-10 minutes, as the dye is toxic and will eventually stain live cells, artificially lowering viability.
Load Chamber: Clean the hemocytometer with 70% ethanol. Place the coverslip. Pipette 10 µL of the mixture into the V-groove. Capillary action will fill the chamber.
Count: View under 10x or 20x magnification. Count cells in the 4 corner squares (1 mm² each).
Count: Bright/refractile cells (Live).
Count: Blue/dark cells (Dead).
Calculate: Apply the formulas from Section 1.
Objective: Determine viability via mitochondrial activity.
Plate Cells: Seed cells in a 96-well plate. Include:
Test Wells: Cells + Treatment.
Control Wells: Cells + Media (No treatment).
Blank Wells: Media only (No cells).
Incubate: Allow cells to adhere and treat with your experimental compounds.
Add Reagent: Add MTT reagent (typically 10-20 µL per well). Incubate for 2-4 hours at 37°C.
Observation: Healthy cells will metabolize the yellow MTT into purple formazan crystals.
Solubilize: Add solubilization buffer (e.g., DMSO) to dissolve the crystals.
Read: Measure Absorbance (OD) at 570 nm using a microplate reader.
Calculate: Apply the background-subtracted formula from Section 2.
Issue | Probable Cause | Solution |
Viability > 100% (MTT) | Evaporation or Hyper-metabolism | Ensure blank wells are correct. Drugs may induce mitochondrial stress (hyper-activity) before death. |
Low Viability (Control) | Over-trypsinization or harsh handling | Limit Trypsin exposure to 2-3 mins. Be gentle when resuspending pellets. |
High Variability (SD) | Pipetting errors or Clumping | Vortex plates gently. Use a multichannel pipette. Ensure single-cell suspension before plating. |
All Cells Blue (Trypan) | Old stain or long exposure | Count immediately (<5 mins) after adding dye. Filter Trypan Blue if crystals appear. |
Negative Values | High Background | Your blank (media + dye) has higher OD than your sample. Check for contamination or precipitation. |
How do you calculate the percentage of cell viability?
To calculate the percentage of cell viability, you divide the number of healthy, living cells by the total number of cells (both live and dead) in your sample and multiply by 100.
How do you determine the viability of a cell?
Cell viability is determined using two primary methods, depending on what defines a "live" cell in your experiment:
Membrane Integrity (Dye Exclusion): Uses dyes like Trypan Blue or Propidium Iodide. Healthy cells have intact membranes that block the dye (staying clear), while dead cells with broken membranes absorb the dye (turning blue/red).
Metabolic Activity: Uses assays like MTT, XTT, or WST-1. These measure enzyme activity (e.g., mitochondrial dehydrogenases) in living cells. The amount of color change in the reagent correlates directly to the number of metabolically active (viable) cells.
What is IC50 in cell viability?
IC50 stands for the Half-Maximal Inhibitory Concentration. It is a standard measure of drug potency in pharmacology and toxicology. In the context of cell viability, the IC50 represents the concentration of a drug or inhibitor required to reduce the viability of a cell population by 50%.
Low IC50: Indicates a potent drug (very little is needed to kill 50% of cells).
High IC50: Indicates a less potent or non-toxic drug (a large amount is needed to kill 50% of cells).
Calculation: It is typically calculated by plotting a dose-response curve (Drug Concentration vs. % Viability) and using non-linear regression analysis to find the midpoint.
How to calculate viable cells?
If you need to calculate the absolute concentration of viable cells (how many live cells are in one milliliter of solution) rather than just the percentage, use the standard hemocytometer formula! Step-by-Step:
Count live cells in the 4 corner squares of the hemocytometer.
Take the average (Total Live Count / 4).
Multiply by your dilution factor (usually 2 if mixed 1:1 with Trypan Blue).
Multiply by 10^4 (10,000) to convert the 0.1 µL chamber volume to 1 mL.
