


1 day ago8 min read
Effect Size Explained: Reporting Cohen's d and Why p-Values Aren't Enough
- 1 day ago
- 8 min read

Your p-value can tell you an effect is real and stay completely silent on whether it's big enough to care about. That second question, the size of the effect, is the one your reader actually has, and it's the one a p-value was never built to answer. Cohen's d is the standard way to answer it for a difference between two means, and reporting it is what turns "we found a significant difference" into "we found a difference this large."
The statistician Jacob Cohen put it more bluntly than we would dare to: the primary product of a research study is a measure of effect size, not a p-value. That's a strong claim, and it's worth taking seriously, because a result reported as "p < 0.05" and nothing else has withheld the single most useful number in the analysis.
This guide covers what effect size is, how to calculate and report Cohen's d for a two-group comparison, how to interpret it without leaning on benchmarks that don't fit biology, and why you should always report it alongside your p-value and confidence interval.
Why a p-value isn't enough
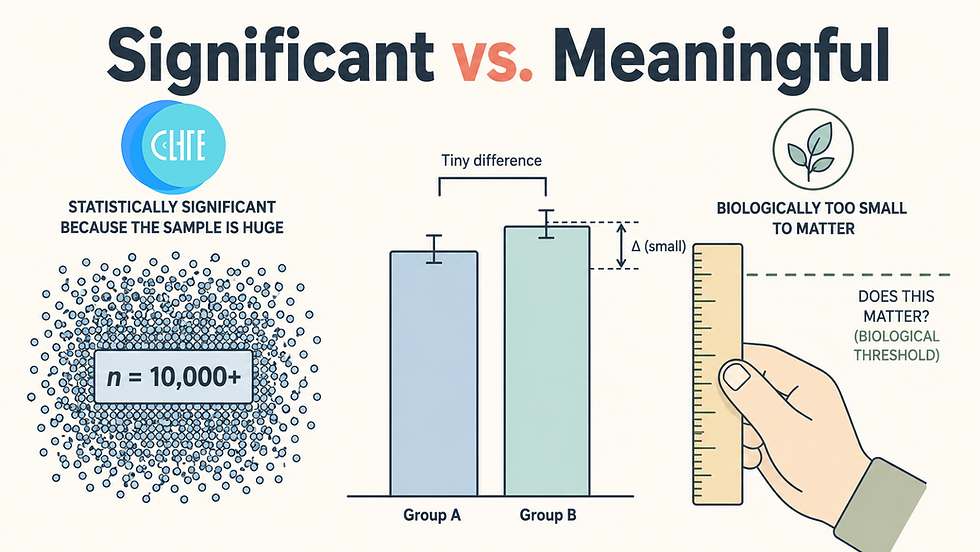
A p-value answers exactly one question: if the null hypothesis were true, how surprising would data like yours be? A small p-value says "surprising, so there's probably a real effect here." Useful, but notice what it withholds. It says nothing about how large that effect is, and it is mathematically tied to your sample size, so with a big enough study almost any non-zero difference becomes statistically significant.
That's the crux. Statistical significance and magnitude are different things, and the p-value only speaks to the first. Effect size speaks to the second, and unlike the p-value it does not inflate with sample size. A difference of half a percent and a difference that changes clinical practice can carry the identical p-value; only the effect size tells them apart. (We covered that split in depth in our piece on statistical versus biological significance; effect size is the tool that operationalizes it.)
Note: this is why "report effect size" has moved from good advice to journal requirement across much of biomedicine. A p-value alone is no longer considered a complete result.
What effect size actually measures
Effect size is a family of measures that quantify the magnitude of a result: how big a difference is, or how strong a relationship is. The right one depends on your design, and picking the matching measure matters more than defaulting to the famous one:
Comparing two means (a t-test-style comparison): Cohen's d.
Binary outcomes (event happened or didn't): odds ratio or risk ratio, and in clinical work, absolute risk reduction or number needed to treat.
Correlation between two continuous variables: Pearson's r.
More than two groups (ANOVA): eta-squared (η²) or omega-squared (ω²).
For much of biomedicine there's an important practical point: the raw, absolute effect in real units (a mean difference of 3.5 mmHg, an absolute risk reduction of 2%) is often more interpretable and more honest than any standardized number, because you can weigh it directly against what matters clinically. Standardized measures like Cohen's d earn their keep when you need to compare across studies or feed a meta-analysis, where the units differ. Report the absolute effect for interpretability; report the standardized effect for comparability.
How to calculate Cohen's d
Cohen's d is the distance between two group means expressed in standard deviations. The formula is simply the difference in means divided by the pooled standard deviation of the two groups:
d = (M₁ − M₂) / SD_pooled
Dividing by the standard deviation is what makes d standardized: the units cancel, so a d of 0.8 means the same thing whether you measured protein concentration or migration distance. The pooled SD is the combined spread of both groups, roughly the square root of the average of their two variances (weighted by sample size when the groups differ in size).
A worked example makes it concrete. Suppose you quantify a protein in two groups and find females at 1.062 ± 0.339 and males at 0.528 ± 0.382 (mean ± SD). The mean difference is 0.534. The pooled SD works out to about 0.361. So d = 0.534 / 0.361 ≈ 1.48: the two group means sit nearly one and a half standard deviations apart, a large separation, and a far more informative statement than "the difference was significant (p < 0.05)."
Tip: you rarely compute this by hand. Any modern stats tool will return d (or Hedges' g, a version corrected for small-sample bias, which is preferable when your n is small). The value of understanding the formula is knowing what the number means, and knowing that a small pooled SD inflates d, so an enormous d sometimes signals unusually low variance rather than a huge effect.
Interpreting Cohen's d without misleading yourself
Cohen offered the benchmarks everyone quotes: d = 0.2 is small, 0.5 is medium, 0.8 is large. They're a reasonable starting vocabulary, but they come with a caveat most people skip, and it matters especially in biomedicine.
Cohen himself intended these thresholds only as a last resort, to be used when you have no field-specific information about what effect sizes are typical. He derived "medium" as roughly the average effect visible to the naked eye across the behavioral sciences, which is not a law of nature and often doesn't transfer to a molecular or clinical context.
Here's the part that should change how you read a small d in medicine: clinically meaningful biomedical effects are often "small" by Cohen's yardstick. Being physically fit is associated with a reduction in near-term mortality risk of about d = 0.08, an effect Cohen's table would call trivial, yet it describes saving lives. Blanketly dismissing a d of 0.1 as unimportant because a psychology-derived benchmark says so is a real error in a clinical setting. The reverse also happens: in some assays with very tight variance, ordinary mean differences produce enormous d values that overstate biological importance.
The honest way to interpret an effect size is against the distribution of effects in your own field, not against a generic table. When field-specific benchmarks exist, use them; several biomedical subfields have published their own. When they don't, report the number, use Cohen's labels only as rough shorthand, and anchor your interpretation in the biology, what a difference of this size actually does to a cell, a pathway, or a patient.
Caution: never let "small effect size" and "not significant" blur together. They're independent. A small effect can be rock-solid and important; a large effect can be non-significant in an underpowered study. Effect size and significance answer different questions, which is exactly why you report both.
Reporting effect size in practice
The modern standard is to report all three numbers together, because each covers a different question: the p-value (is it distinguishable from noise?), the effect size (how big is it?), and the confidence interval (how precise is that estimate, and what's the plausible range?). Together they let a reader judge whether your finding is real, large, and reliable. Any one alone leaves a gap.
In practice that means writing results like "females showed higher expression than males (d = 1.48, 95% CI [x, y], p < 0.05)" rather than stopping at the p-value. It's a small change in habit with a large change in how much your reader learns. Tools that surface the effect size and its interval next to the test result make this the default rather than an extra step (Sophie's analytics engine reports Cohen's d and the confidence interval alongside the p-value and labels each, so the magnitude question never gets dropped). The number that tells your reader how much your result matters should never be the one you leave out.
The takeaway
A p-value tells you an effect probably exists; an effect size tells you how much it exists, and for a two-group comparison Cohen's d is the standard measure, the mean difference scaled by the pooled standard deviation. Use Cohen's 0.2/0.5/0.8 labels only as rough shorthand, because clinically vital biomedical effects are frequently "small" by that scale; interpret against your own field and the underlying biology instead. Report the effect size and its confidence interval next to every p-value, and your results will finally answer the question your reader was asking all along: not just whether something happened, but how much.
FAQ
What is the difference between a p-value and an effect size? A p-value tells you whether an effect is likely real (distinguishable from chance); an effect size tells you how large that effect is. The p-value depends on sample size and can be tiny for a trivial difference in a large study, while the effect size measures magnitude independently of sample size. They answer different questions, so both should be reported.
How do you calculate Cohen's d? Cohen's d is the difference between two group means divided by the pooled standard deviation of the groups: d = (M₁ − M₂) / SD_pooled. The pooled SD combines the spread of both groups. Because the units cancel, d is a standardized, unitless measure of how far apart the means are in standard-deviation units.
What is a good Cohen's d value? Cohen's conventions call d = 0.2 small, 0.5 medium, and 0.8 large, but these are rough defaults he intended only when field-specific information is unavailable. In biomedicine many important effects are "small" by this scale (for example, effects that reduce mortality), so interpret d against typical effects in your own field rather than treating the benchmarks as universal.
Should I use Cohen's d or an absolute effect size? Both have a place. Absolute effect sizes in real units (a mean difference in mmHg, an absolute risk reduction) are usually more clinically interpretable. Standardized measures like Cohen's d are essential when comparing across studies or performing meta-analysis, where the original units differ. Reporting the absolute effect for interpretability and the standardized effect for comparability is good practice.
Does a large Cohen's d always mean a biologically important effect? No. Because d divides by the pooled standard deviation, unusually low variance can inflate d to very large values even when the raw difference is modest. Always check the actual mean difference in real units and judge importance against the biology, not the standardized number alone.
Why isn't statistical significance enough on its own? Because significance only tells you an effect is unlikely to be chance, not whether it's large enough to matter, and it scales with sample size. A big study can make a meaningless difference significant; a small study can miss a large real one. Effect size (plus a confidence interval) supplies the magnitude and precision that the p-value omits.
